Getting Started
Unforgettable.me is a platform for the collection, retrieval, analysis and visualization of experience sampling data. In this tutorial, we are going to cover how to register and then use both the search and visualization interfaces. In subsequent tutorials, we will discuss how to install and configure the unforgettable.me app, how to use IFTTT as a data source, how to interact with the unforgettable.me data marketplace and how to run analyses.
Figure 1 shows the basic architecture of the platform. Data comes from the unforgettable.me app, IFTTT or is entered directly into the website through surveys or embedded experimental software. Once you have data stored you can use the search interface to retrieve the events you are interested in. A number of visualizations are available that allow you to see trends over the events you have retrieved.
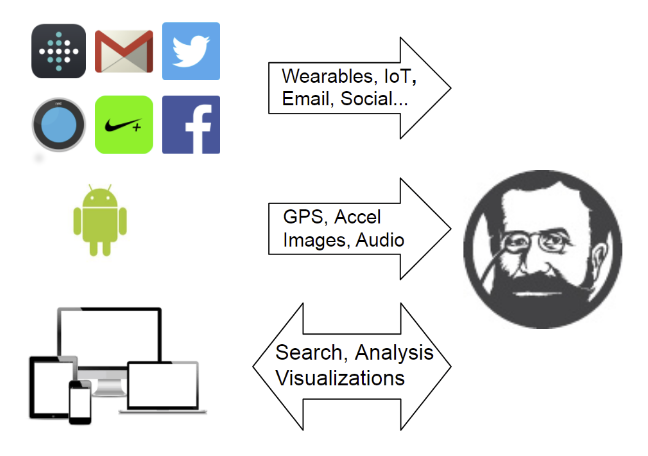
Login to the demo account
Of course, at this stage you have yet to collect any data. For the purposes of the tutorial, we have created an account that you can access. Firstly, navigate to www.unforgettable.me in your browser (see Figure 2).

Click on the login link at the top right of the home page and use demo@unforgettable.me for both the username and password. This account contains a small subset of the data of Professor Simon Dennis, one of the founders of unforgettable.me.
Searching for data

You will now see a search box much like those that you would be familiar with from search engines like Google or Bing. When you type terms into this box, however, events from the user’s life are returned. Try typing "netherlands" in the box and then selecting "All time" from the date selector menu (see Figure 3). Next, you should see the screen in Figure 4.

There are a total of 64 events in the account that have something to do with the netherlands. The first event is an National Public Radio article that appeared at 7am on March 30th 2018. It reports the death of Dutch school teacher Johan van Hulst who saved the lives of hundreds of Jewish children during the Nazi occupation of the Netherlands. This event came from NPR through the IFTTT interface with unforgettable.me. You might wonder why we would want to store news events as they are not personal data. The motivation is that people will often encode the time at which personal events have occurred in relation to public events (e.g. where were you when President Trump was elected?). You may not remember exactly when these events occurred, however, but if you retain the NPR events you will be able to look them up and refine your search.
Restricting search results
Now try typing in the query "netherlands __App__" and hit enter on your keyboard. You should see a result set like that in Figure 5. The __App__ tag has limited the scope of the query to just the data that came from the unforgettable.me app.
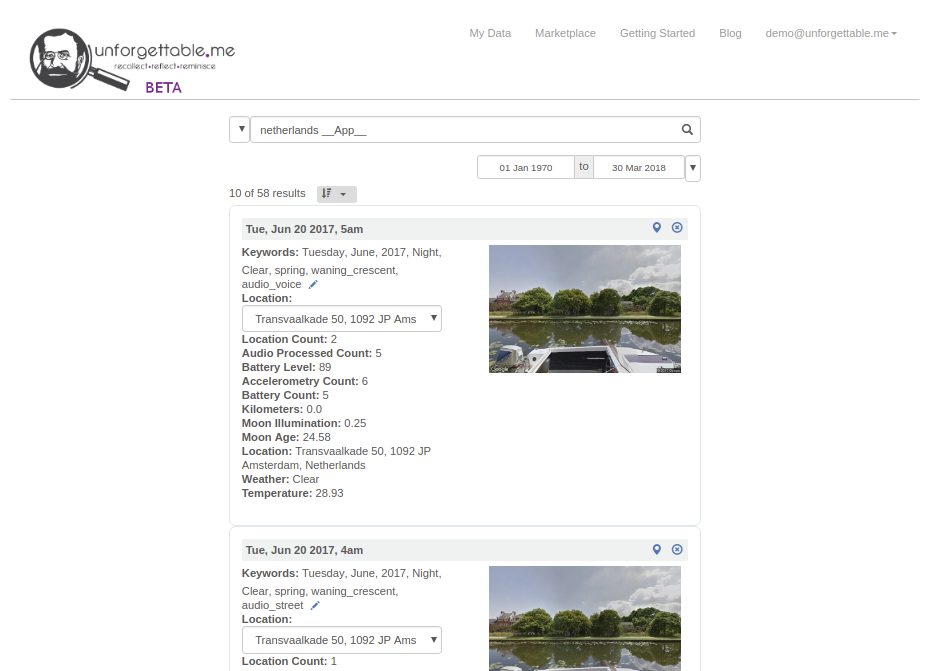
The data returned by the unforgettable.me app can include GPS, accelerometry, obfuscated audio, battery level and images. Events capturing each hour are constructed from this raw data. A set of keywords are generated that includes indicators of the day, month, year and time of day (morning, afternoon, evening and night). You can add your own tags using the small blue pen icon if you wish. In addition, the season and the moon phase are included. Forecast.io is used to determine what the weather was like in that location at the time (e.g. Clear) and our custom audio machine learning classifiers are used to determine that nature of the ambient sound environment (e.g. audio_voice indicates there were voices recorded during this hour period). Google Places is also used to indicate the kind of place (restaurant, church etc) at this location, although there was no data available for these particular events. Google Places is also used to provide the address of the current location, which what has allowed these events to be returned in response to the Netherlands query.
A number of quantitative variables are also derived. A number of indicators of the stored data are provided such as the number of location records or the number of accelerometry records. These numbers are useful to understand what data you have and to ensure you are collecting what you expect. In addition, the temperature, moon age and illuminations, the number of kilometers traversed and the battery level are available. In the top right hand corner of each event you can see a small x. Clicking on this icon will move the event to trash, from which it can be subsequently be deleted.
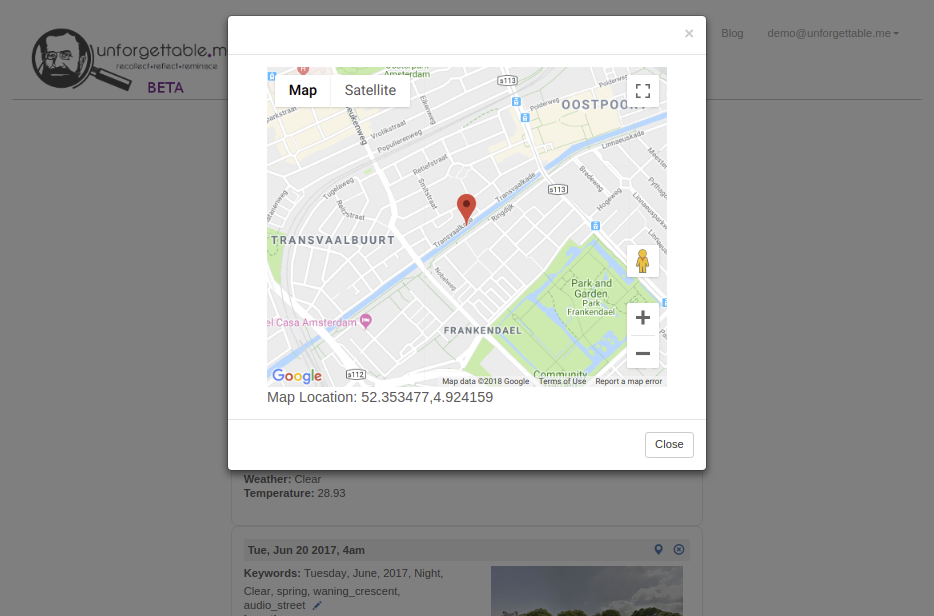
Try clicking on the location icon next to the delete icon. You should see a map appear showing the location of the event (see Figure 6).
Visualizing data
To the left hand side of the search box you will see a drop down menu that provides access to the visualizations and other functions like trash and the ability to download your data. Search for "bar beach" and then select the Event Count Calendar from the drop down. You should see a screen as in Figure 7.
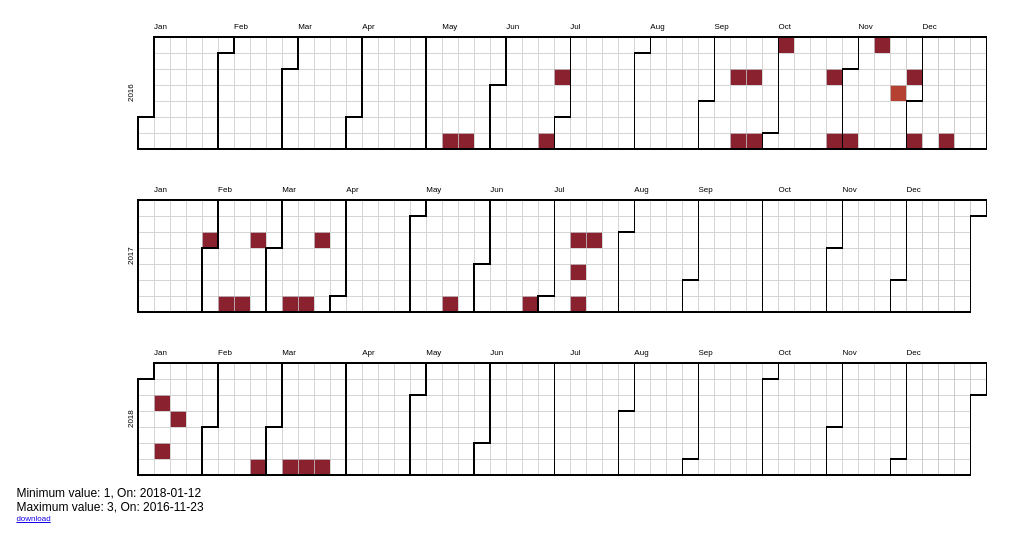
The boxes represent days and are colour coded according to the number events from the query that appeared on that day. Professor Dennis plays tennis at Bar Beach and so the calendar provides visualization of the regularity with which he plays. A forensic analysis allows one to establish the specific times of certain events. For instance, he injured his arm at the start of July 2016 and you can see that this hampered play for about two months. In August 2017 he started a new job in a different city and so was not able to play as often.
There are many visualization options to explore. We will investigate just one more. Just under the search bar you will see two date pickers. Set the first one to 01 April 2017 and the second one to 31 March 2018, issue the query "weight" and select the chart visualization. You should see a screen like that in Figure 8.
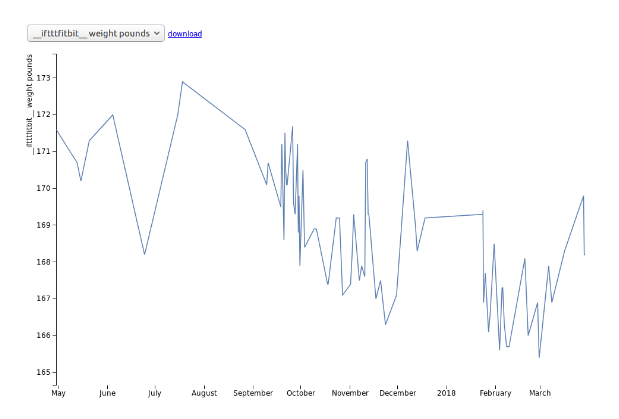
These values were transmitted from Professor Dennis’ Aria scales through IFTTT to unforgettable.me. You can see that he lost of few pounds just after he took up his new job in August 2017, but that his weight has stabilized since then.
Registering your own account
For the exercises in the following tutorials, you will need your own unforgettable.me account. Firstly, logout from the demo@unforgettable.me account (the logout option is in the dropdown menu in the top right hand corner of the screen).
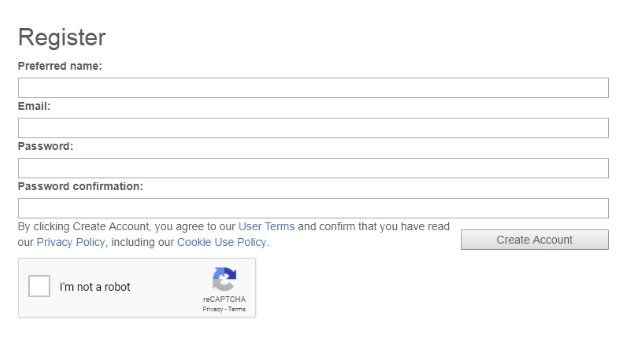
Then, click on register in the top right hand corner. You will be shown a standard registration page (see Figure 9). A confirmation link will be sent to your email address. Click on the link provided there to establish your account.
That is the end of the first of the unforgettable.me tutorials. In the next one, we will demonstrate how to install and configure the unforgettable.me app.