Data Analysis on unforgettable.me: Regression
Prerequisites:
Data Analysis on unforgettable.me: Getting Started and Descriptive Statistics
Data Analysis on unforgettable.me: Preprocessing Your Data
In the previous tutorials, we discussed how to navigate to projects, to generate descriptive statistics and how to preprocess the data in preparation for analysis. In this tutorial, we will describe how to conduct a regression analysis.
One might anticipate that the temperature should rise as one gets closer to the equator. To test the hypothesis with our sample, navigate to Demo Project (Event Segmentation V2) and click Regression.
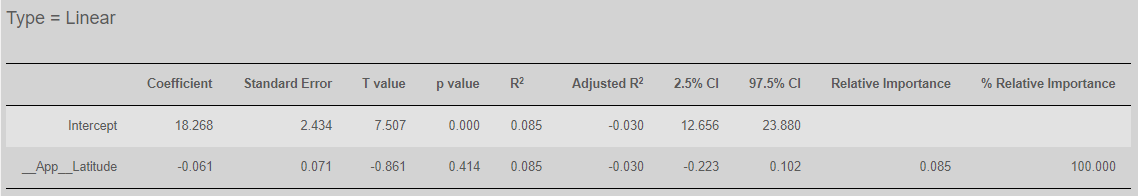
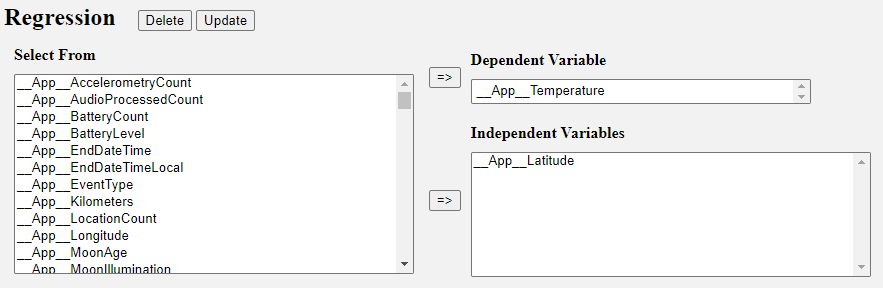
Select __App__Temperature as the Dependent Variable and __App__Latitude as the Independent Variable and click Update. On the right hand side you will see the following results:
A linear regression has been selected because the dependent variable is numeric. The columns give the regression coefficient, the standard error of the coefficient, the T value and p value, the R2 of the model and the adjusted R2 of the model, the 95% confidence interval of the coefficient and the relative importance and % relative importance of each predictor.
As you can see the R2 of the model is very low (and the adjusted R2 even lower) and the __App__Latitude is not significant, so the model is not doing well. One possible explanation is that one would expect both large positive values and large negative values to have lower temperature. Latitude does not have a linear relationship with temperature.
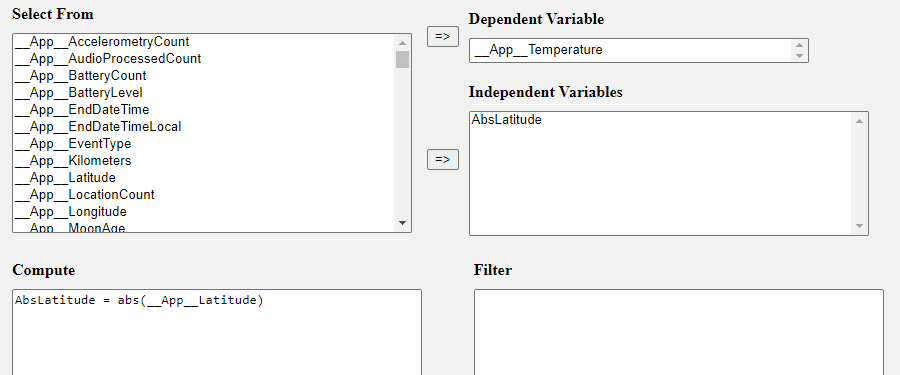
As a consequence, a better predictor of temperature might be the absolute value of __App__Latitude, rather than __App__Latitude itself. We can test this hypothesis by defining a new variable which we will call AbsLatitude as follows:
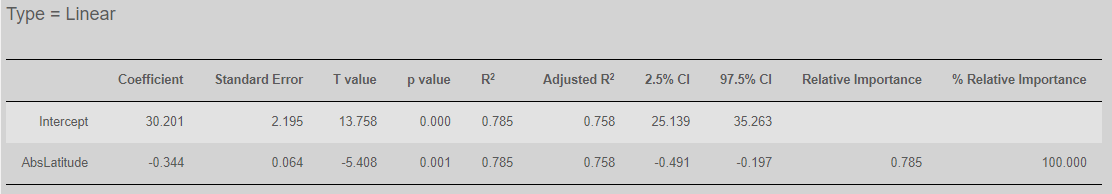
Now when you click Update you will see the following results:
We have a much higher R2 and a p value of 0.001. The model is doing well as we might have expected.
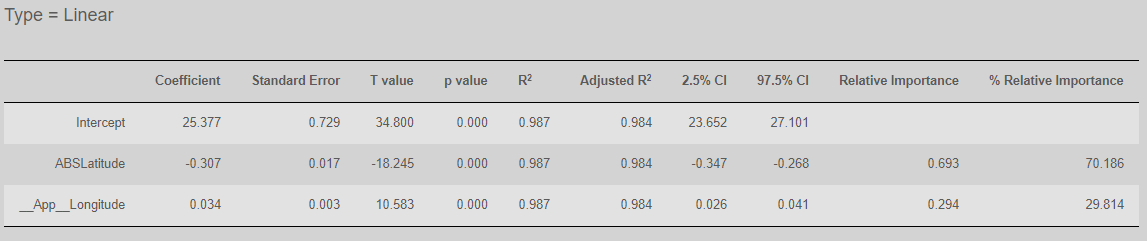
In regression analyses, we are typically interested in more than one variable. To incorporate another variable (e.g. __App__Longitude) add it to the Independent Variables list and click Update:
You can see that we are now capturing more of the variance (R2 has gone up) and __App__Longitude is also significant. We can use the % relative importance to estimate the contribution of each variable to improving the variance (even when the independent variables are correlated). In this case, we see that _App__Longitude helps, but it is still AbsLatitude that is doing most of the prediction work in our model (70%).
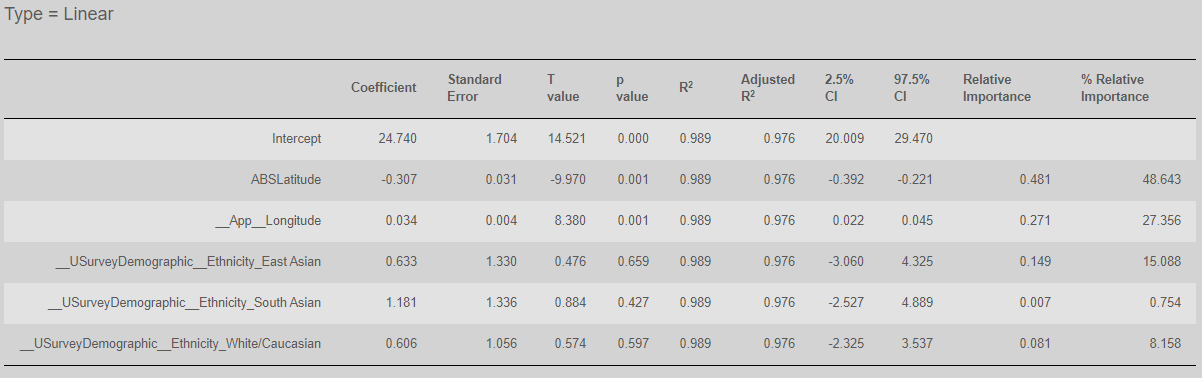
When categorical variables are included as predictors, they are recoded as dummy variables. For instance, if we add ethnicity to the model, three new variables are automatically created __USurveyDemogrphic__EastAsian, __USurveyDemogrphic__SouthAsian and __USurveyDemogrphic__WhiteCaucasian. The analysis provides coefficients, p values etc for each of these variables:
In this case, the R2 has increased very little when ethnicity is included suggesting that it adds very little to the model once absolute latitude and longitude have been included.
If we use the  analysis to create a frequency table for ethnicity, we see that there are actually 4 values represented in our sample:
For the purposes of regression, the African category was coded as all 0s, while each of the other categories were coded as a 1 in one column and 0s in the other columns. The model takes African as the default and other results are relative to the African category.
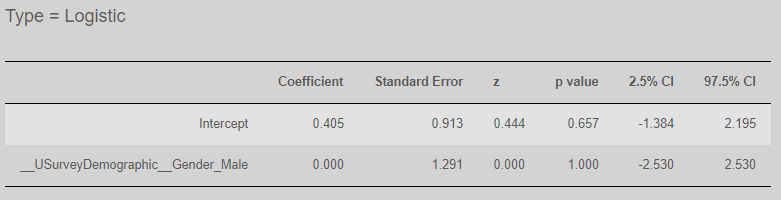
The temperature variable is numeric and so a linear analysis can be employed (although it is always a good idea to plot your variables to check for nonlinear effects - additional diagnostics to check the assumptions of regression are under development). However, the interface will switch to logistic regression if the dependent variable is boolean, as in this case we assume that we wish to predict the probability that the variable will be True.
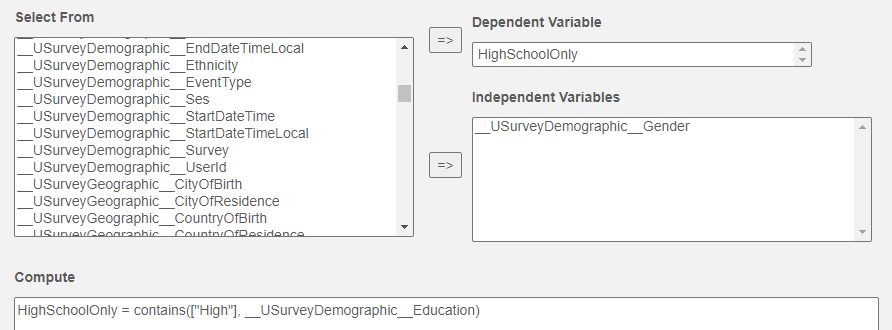
Let's suppose we are interested in whether gender affects the likelihood that a person has a tertiary degree. We could create a new boolean variable, HighSchoolOnly as follows and add gender as the independent variable:
At least in our sample, we don't have sufficient evidence to suggest there is an effect:
as the p value is not below our alpha value of 0.05.
Regression is a powerful tool that allows us to determine how well one variable predicts another. At the time of writing, unforgettable.me can take numeric, categorical or boolean variables as independent variables and numeric or boolean variables as dependent variables. Using a categorical variable as a dependent variable requires the use of multinomial logistic regression, which has yet to be developed.
That concludes our coverage of regression on unforgettable.me.