Data Analysis on unforgettable.me: Correlation
Prerequisites:
Data Analysis on unforgettable.me: Getting Started and Descriptive Statistics
Data Analysis on unforgettable.me: Preprocessing Your Data
In the previous tutorials, we discussed how to navigate to projects, to generate descriptive statistics and how to preprocess the data in preparation for analysis. In this tutorial, we will describe how to conduct a correlation analysis.
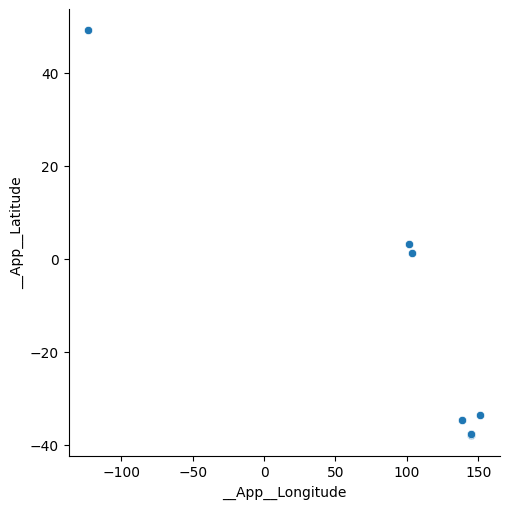
As it so happens, in our sample latitudes and longitudes are negatively correlated in Demo Project (Event Segmentation V2):
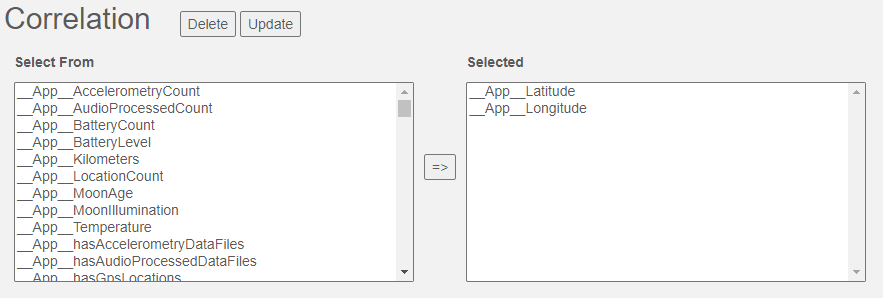
To calculate the correlation and test its significance, click on the Correlation button to create a new correlation analysis, select __App__Latitude and __App__Longitude and click Update.
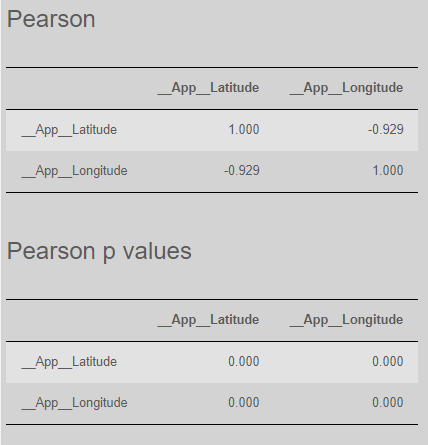
In the report on the right hand side, you first see a table of the Pearson correlations followed by a table of the corresponding significance values.
In this case, the p values are all less than 0.001.
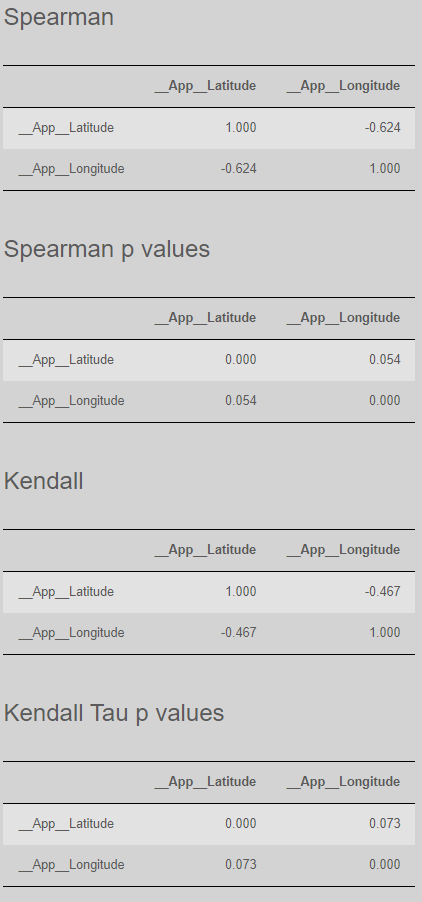
Next you will see two forms of rank correlation - Spearman's (followed by the associated p values) and Kendall's Tau (followed by the associated p values). These correlations are more appropriate when data may contain outliers.
As you can see the existence of the point in the upper left[a], significantly inflates the Pearson correlation relative to the Spearman and Kendall rank correlations suggesting that the rank correlations might be more appropriate in this case. And that's it for correlation analysis.